
Investigate a crashing pod
A restart counter tells you that a container restarted. It does not tell you why, whether the current process has the same failure, or whether an event with the same Pod name belongs to the same Pod instance. This workflow builds a small, reviewable evidence set before you change the workload.
Where to find it
Section titled “Where to find it”Open the cluster from Fleet, then choose triage → incidents. Set the namespace with the picker above the incident list. You can also open triage → pods to inspect every Pod, but the investigation controls described here begin on an incident card.
You need permission to read the Pod, its owner/controller, Events, and the Pod log subresource. Partial permission is supported: Lumen marks a failed source unavailable and retains any other evidence it could read. Previous logs exist only when Kubernetes still retains the last terminated container instance.
Select the incident and container
Section titled “Select the incident and container”- Confirm the cluster context and namespace before reading an incident. Use filter by namespace, resource, evidence… when the list is large, then choose refresh if you need a new snapshot.
- On the relevant Pod incident, read the severity, resource identity, summary, and evidence. Choose investigate. Lumen opens Investigate pod/name and records the investigation start time.
- Under Container, select the failing container. Each option shows its current state and restart count. Lumen initially favors a non-ready or frequently restarted container, but verify the choice yourself.
The investigation reads the selected resource, Pod containers, matching Events, and current owner/controller snapshots. Events are included only when their involved-object UID matches the selected resource UID. If the UID is unavailable, name-only Events are excluded as unverified. Owner and controller data is a current snapshot; it is not a complete rollout history and cannot establish that a rollout caused the crash.
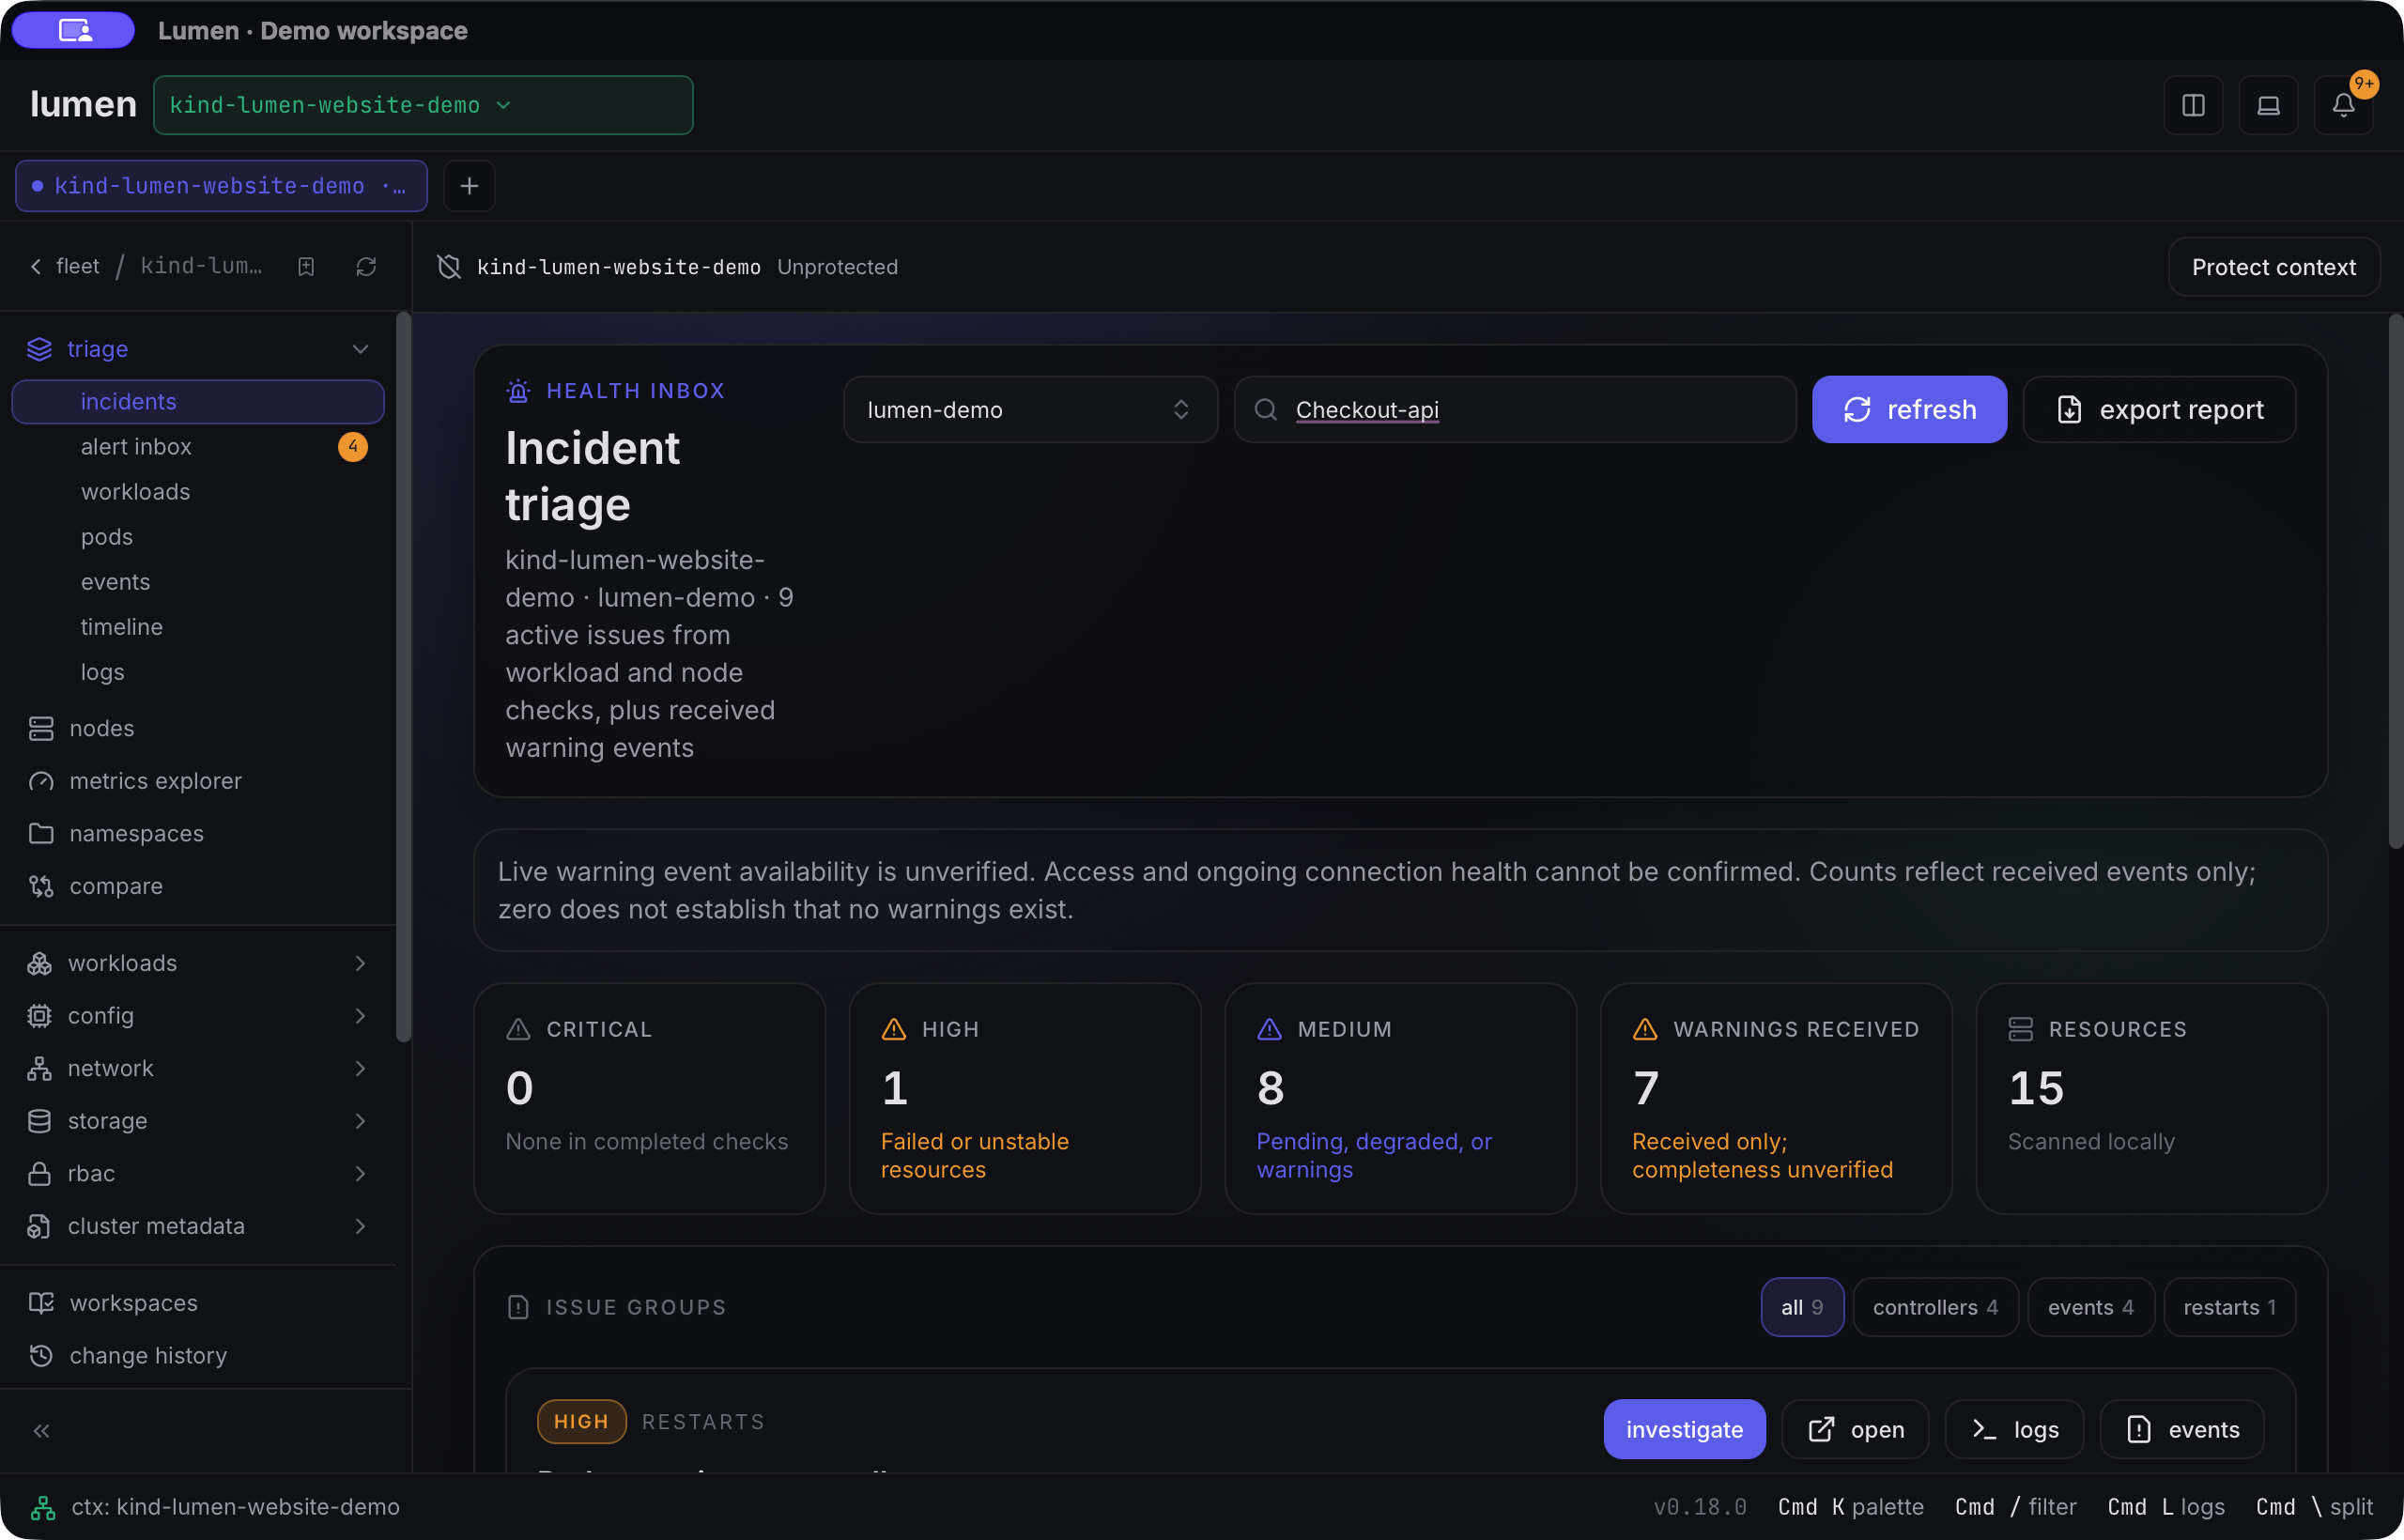
Real Lumen main-build capture (17 September 2026), with synthetic workloads. This workflow is available in v0.18.0. Select the image for full size. The selected namespace and pod remain visible.
Read current or previous logs
Section titled “Read current or previous logs”Choose current logs · container to open the live log screen for the selected container. This is useful when the replacement process is running long enough to emit the same error again. On that screen, the status line says Current container logs; use its search/filter controls and download only if you need the displayed log stream outside Lumen.
When the selected container has restarted, previous logs · container appears in the investigation. Choose it to read Kubernetes’ retained log for the last terminated instance. The log screen labels this Previous container logs (retained last instance) and offers current logs to switch back. If Kubernetes has already rotated or discarded the previous log, the empty or failed result is missing evidence, not evidence that the prior container was healthy.
The general log screen does not prove an exact container-instance identity. A Pod can be replaced while keeping the same name, and Kubernetes does not expose a distinct UID for each container restart. Reconfirm the context, namespace, Pod, container, Pod UID, and restart count before drawing a conclusion.
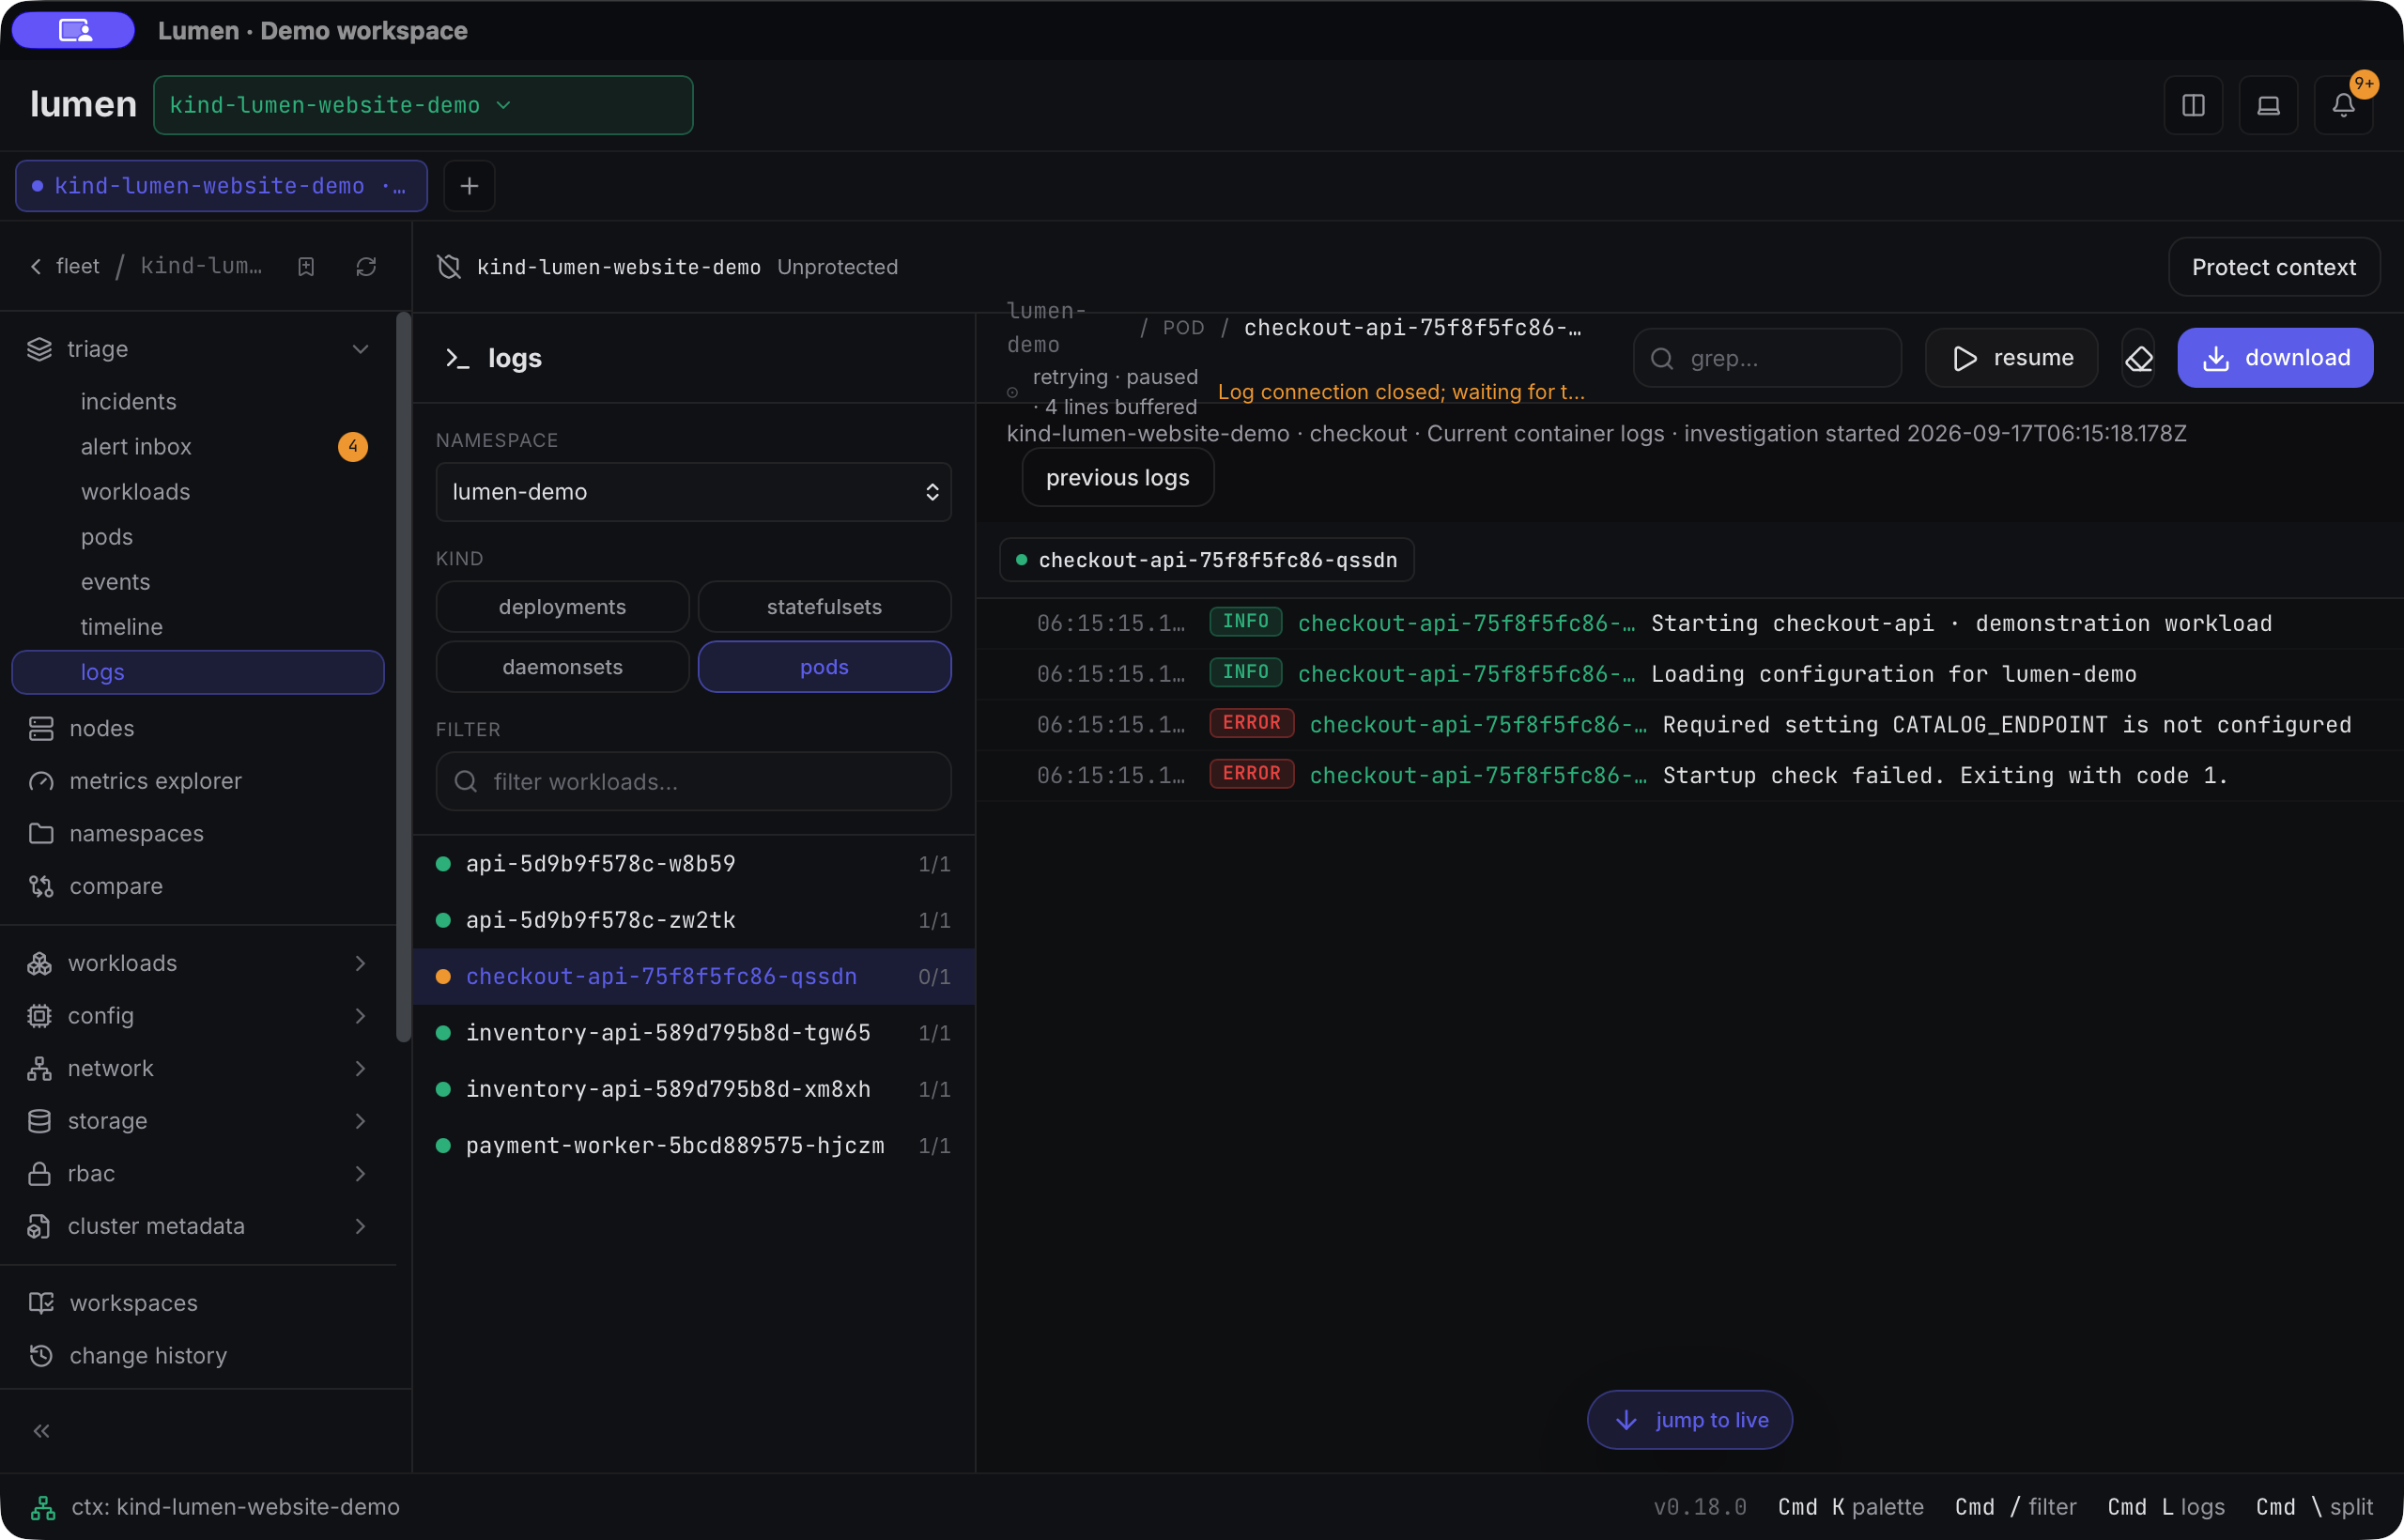
The current log buffer contains the application’s startup error. A stopped container can close the stream; buffered evidence remains visible. Previous logs may be unavailable after retention or container replacement.
Capture bounded evidence
Section titled “Capture bounded evidence”Return to the investigation before remediation. Leave capture previous instance unchecked for current logs, or check it for the retained previous log, then choose capture bounded logs. Capture is explicit and finite: at most 200 lines and 20,000 characters. It does not follow a live stream indefinitely.
Lumen requires a Pod UID for this capture and validates the Pod identity around the bounded read. If the UID is missing, it refuses a name-only capture. If the Pod is replaced during capture, the log result is excluded from the bundle to avoid attributing it to the old incident. A timeout, access denial, unavailable previous log, or other read failure is recorded as an error without fabricated log text.
Review Log evidence preview. Remove unrelated lines or add a short explanatory edit, then keep or clear include edited excerpt in export. The excerpt remains bounded. Redaction covers common credential patterns on a best-effort basis, so inspect the preview for application-specific secrets, personal data, tokens, URLs, or identifiers before including it.
Choose export investigation to review the report. It includes source freshness, UID-matched Events, current owner observations, the selected log status and bounds, and the edited excerpt only when included. Export is local; it does not upload or send the report.
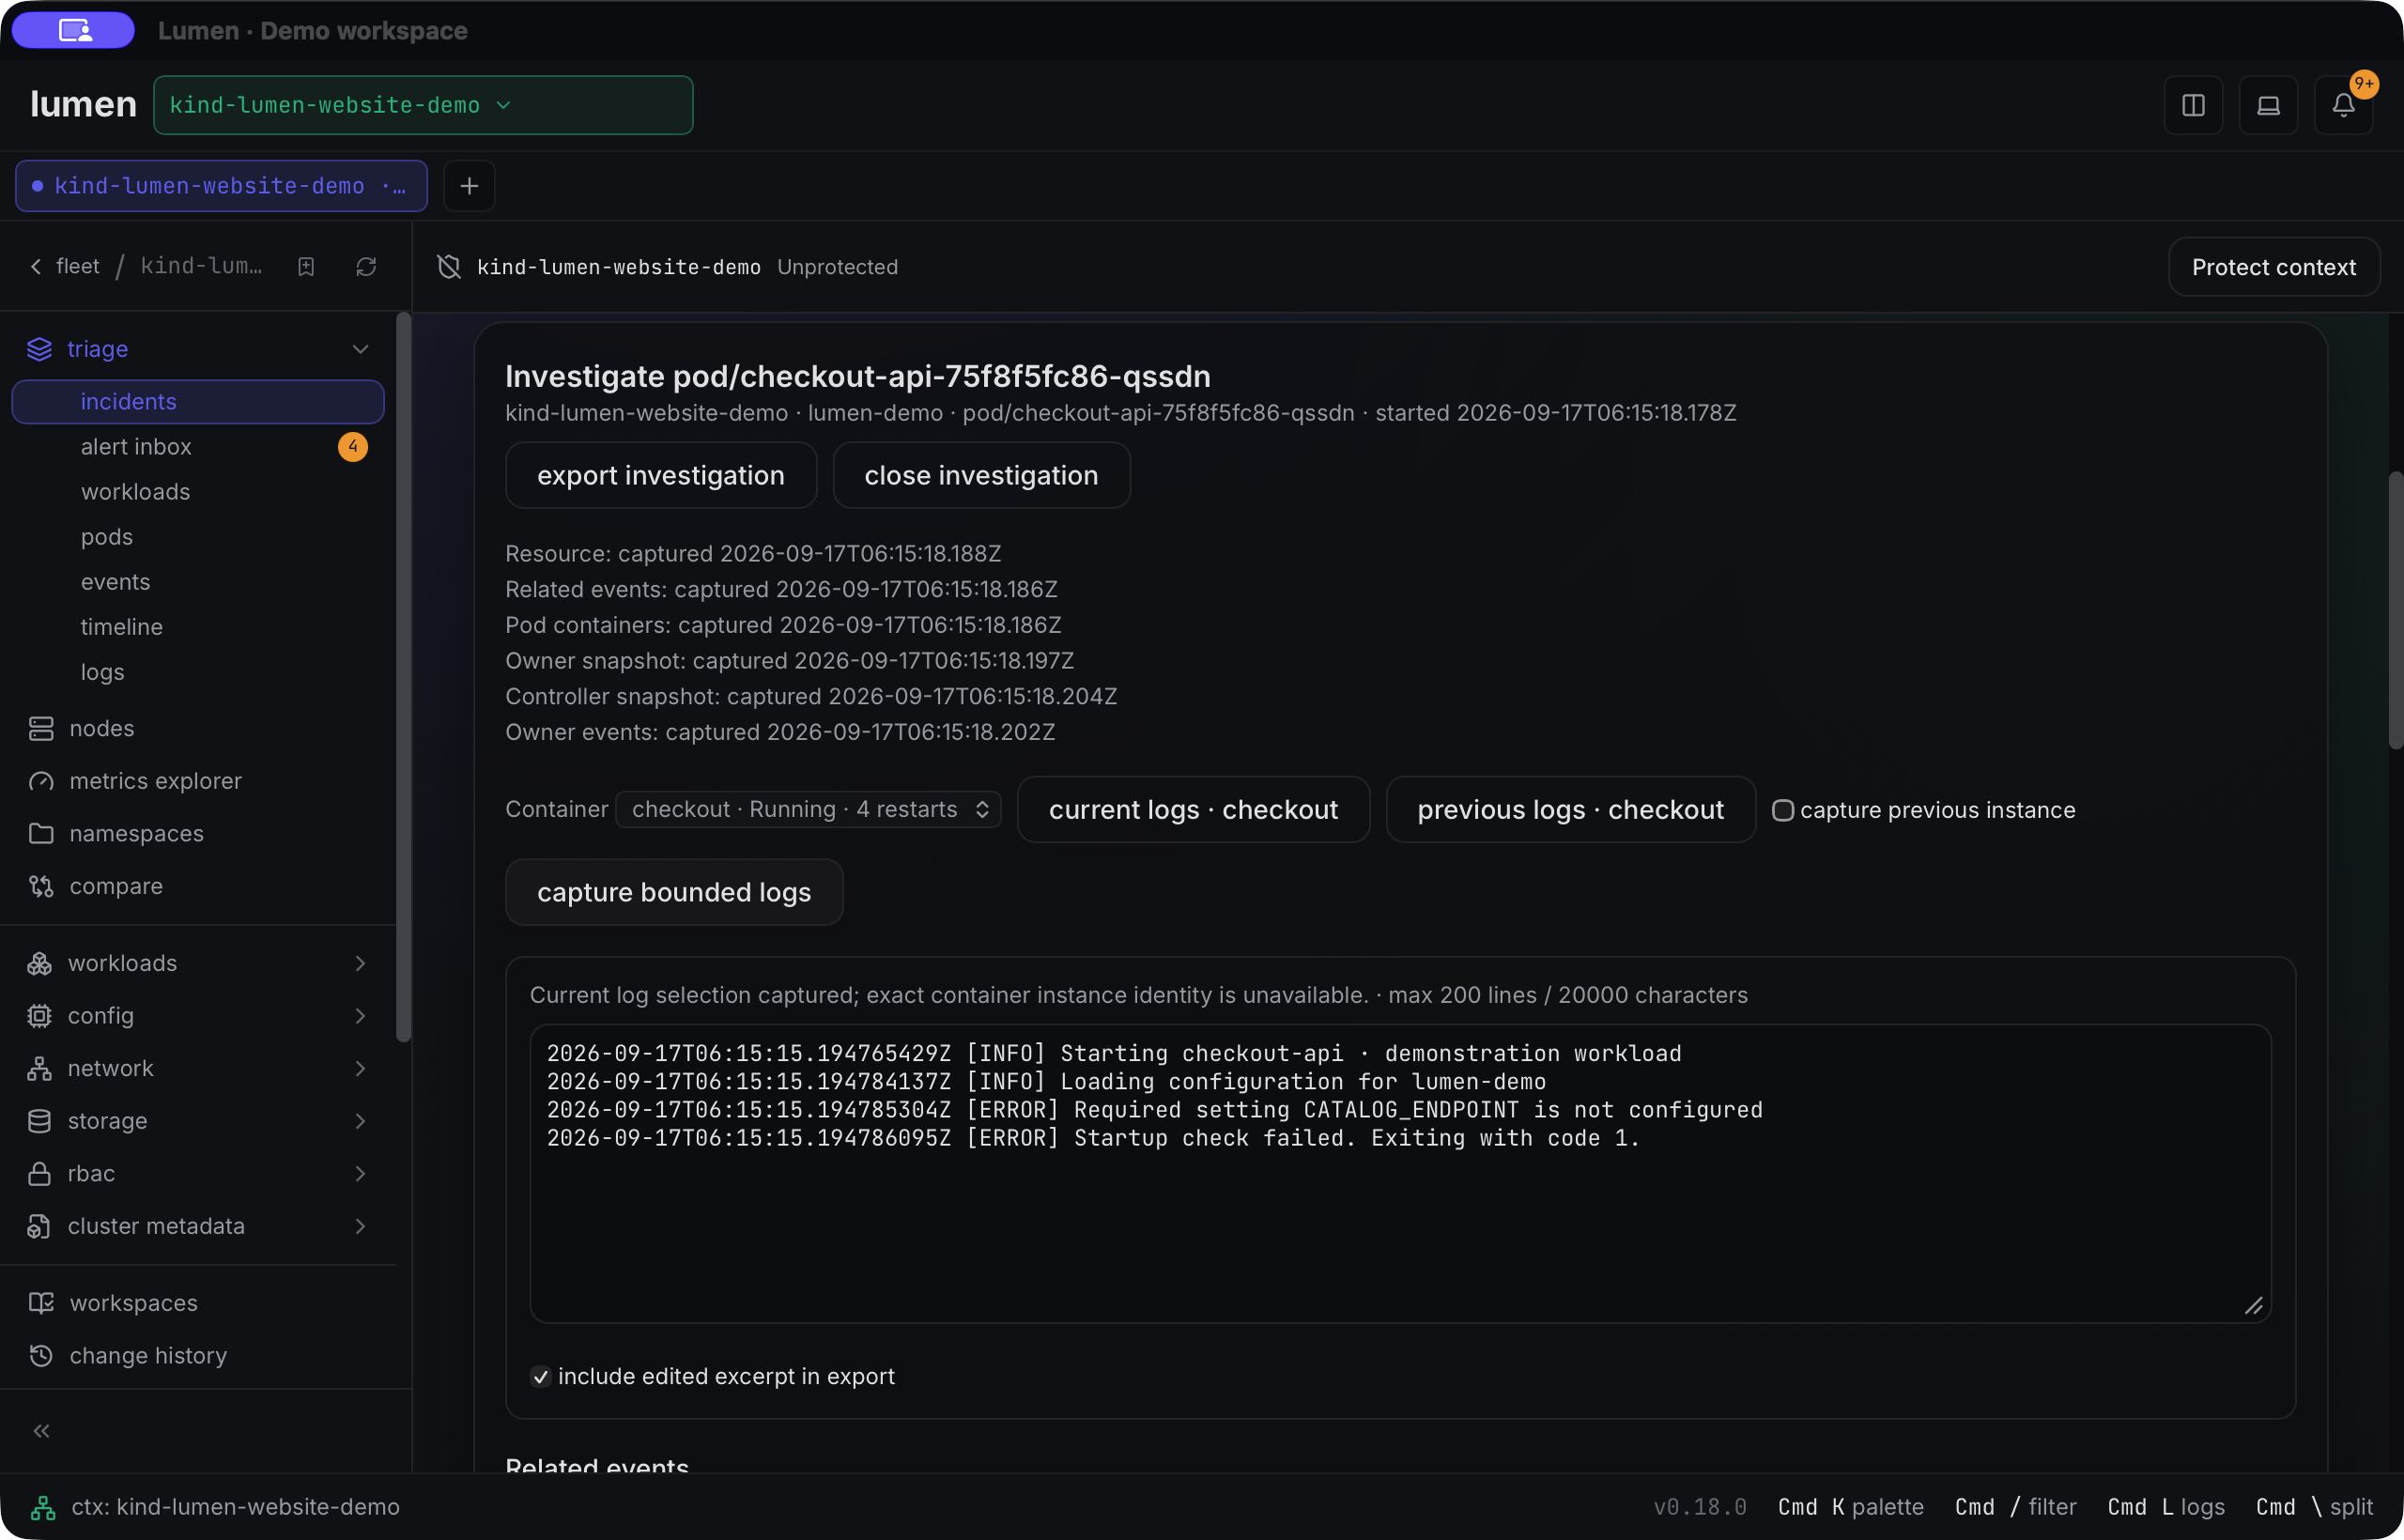
This capture uses the current log selection. The excerpt, inclusion checkbox, source timestamps and related events are actual application controls and output.
Expected outcome and next steps
Section titled “Expected outcome and next steps”You should finish with a timestamped statement such as: “Pod UID matched; container restarted four times; previous log ended with an application configuration error; owner was healthy in the current snapshot; rollout history was unavailable.” Keep unavailable evidence visible.
Use the result to choose the smallest next action: correct configuration through its owning deployment process, inspect probes or resource limits, compare related replicas, or escalate the local report. Recheck the new Pod UID, restart count, Events, and current logs after remediation. A plausible log message is a lead; successful recovery requires observed healthy state.
Sources: TriageView.tsx, TriageInvestigation.tsx, LogsTab.tsx, logEvidence.ts, and incidentReport.ts at v0.18.0.